actware LPS

 
Line Performance Software
 

Line Performance Software

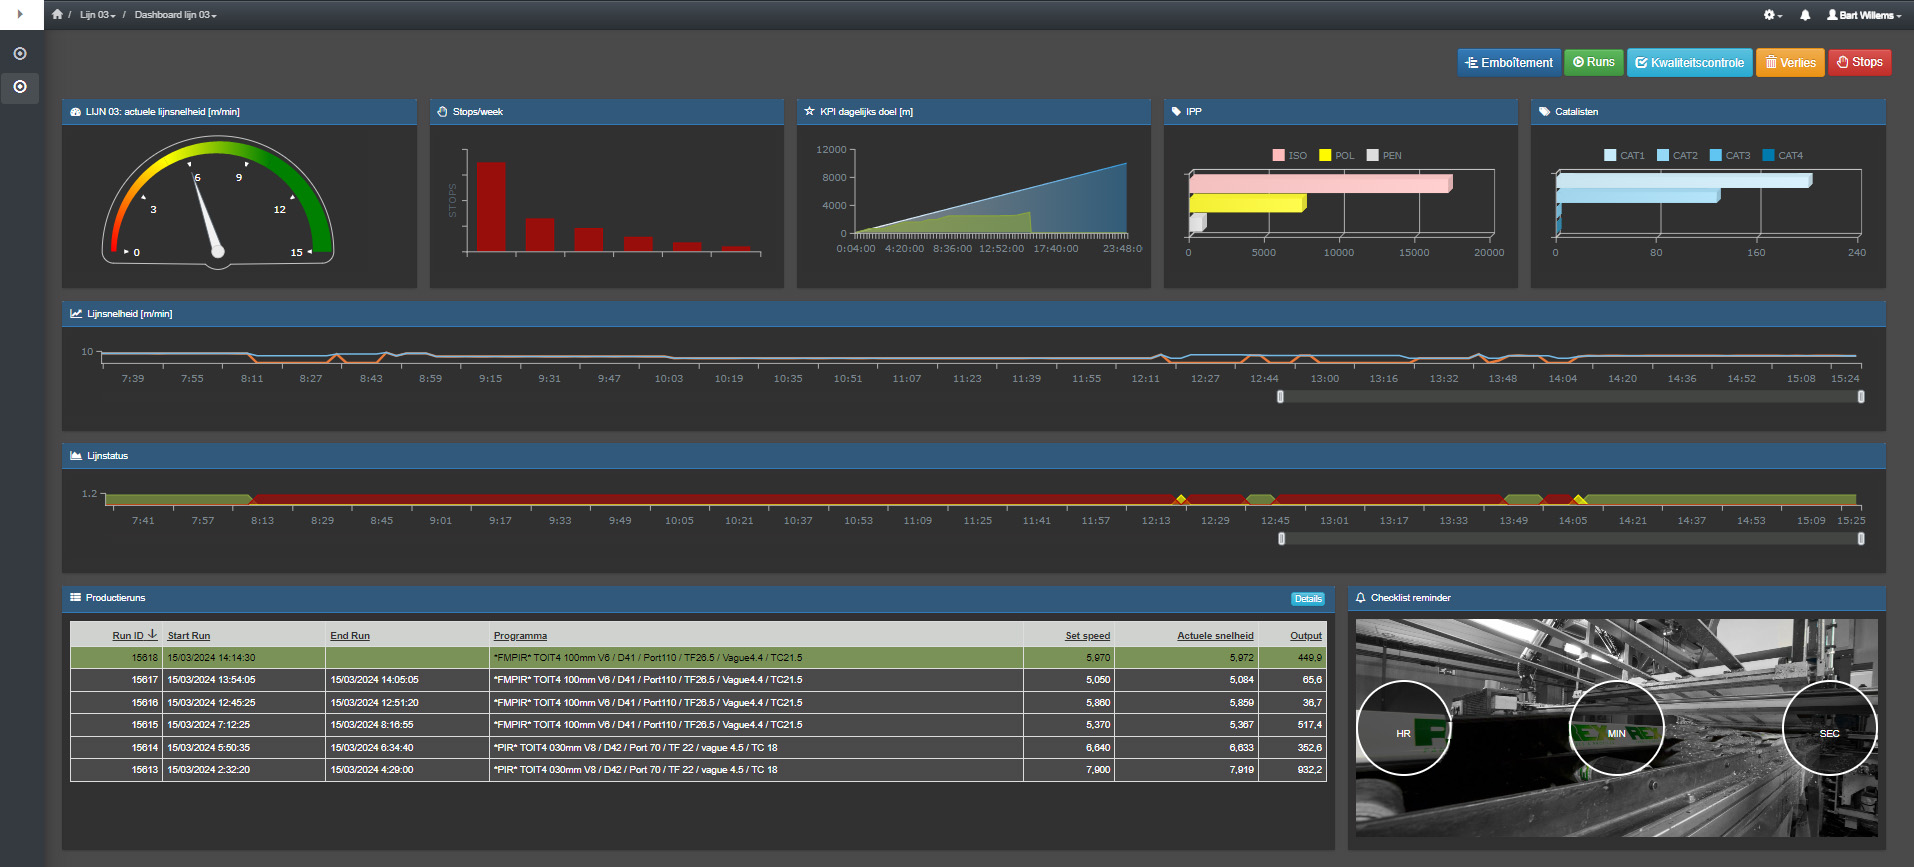
The time when machines work as stand-alone units is over. Data communication with ERP software, logging systems and analysis software have become unthinkable in today's Industry 4.0. BFP develops software that captures and analyzes production data and reports the efficiency of the production process in real time. An indispensable tool for actual costing and online production monitoring, for the operator, the process engineer and the operational management.

actware LPS provides the ability to create operational expertise by collecting and analyzing realtime production data.


Follow closely, save and improve quality

To get a correct picture of production loss, a reliable registration program is indispensable.

Traditional yield calculations do not reflect the improvement potential.

actware LPS is OEE software that reads machine data, compares the results with the production schedule and illustrates where and why production loss has occurred.

Analyzing correct and reliable data offers the opportunity to make the right decisions, on the way to a success story.

 
Follow closely, save and improve quality


Determine the improvement potential

The lower the result of the OEE calculation, the higher the potential to improve efficiency. However, if you are already satisfied with the result, then one of your KPIs may be to maintain this result. Production parameters and raw materials are prone to change and machines simply age. Use actware LPS as a watchdog during your daily team meeting and always respond quickly.


OEE as a measuring instrument

Machines who produce loss-free have an OEE of 100%.
OEE can be expressed as the product of the availability of the machine, the performance of the machine (speed of production) and the quality of the articles produced.

OEE=Availability x Performance x Quality

In general, the aim is to achieve an OEE of 80%-85%. Our practical experience teaches us that most companies achieve an OEE of 45%-55% at start-up and can evolve to an OEE of 70%-80%.
One must be aware of the machine losses in order to be able to reduce them. Machine losses arise both planned and unplanned due to standstills, changeover times and quality losses.

With the Pareto chart included in our reporting, you can make analyzes on the 20% most important causes of failures that lead to 80% of the consequences.

 
OEE as a measuring instrument


Service and creativity are undoubtedly our strongest assets.

Technology partners

Technology partners
Technology partners
Technology partners
Technology partners